
Crypto Market Analysis: Key Trends & What to Watch This Week
Navigate the dynamic crypto market. This analysis covers inflation impacts, regulatory shifts, and technical indicators for the week starting October 12, 2026.
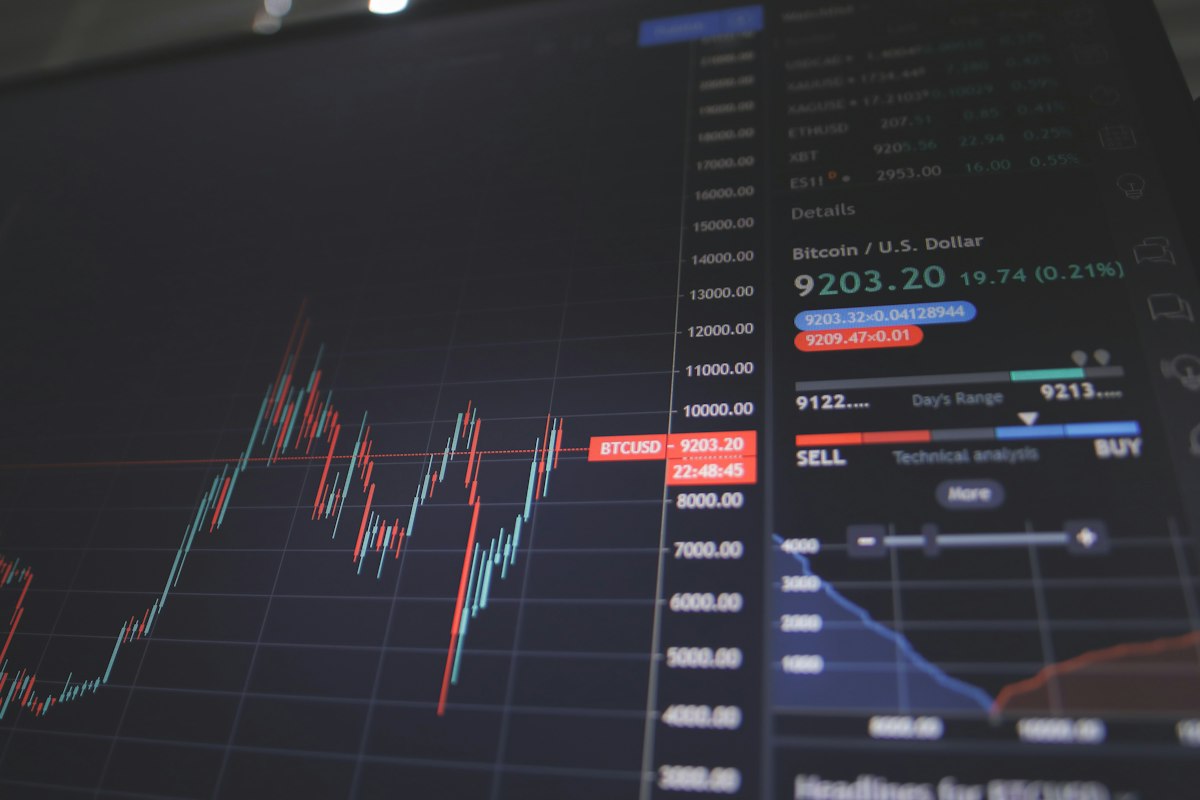
Key takeaway As of October 12, 2026, the crypto market remains highly sensitive to global macroeconomic shifts, particularly inflation data and central bank policies. Traders are also closely monitoring the evolving regulatory landscape and key technical levels for Bitcoin and Ethereum to gauge short-to-medium term sentiment.
What are the current macroeconomic factors impacting crypto?
Global macroeconomic trends continue to exert significant influence on the cryptocurrency market. Inflation data from major economies, particularly the US and EU, are paramount. Higher-than-expected inflation often leads to tighter monetary policies from central banks, such as interest rate hikes, which can dampen investor appetite for risk assets, including cryptocurrencies. Conversely, signs of decelerating inflation might signal a more dovish stance, potentially boosting crypto valuations.
Beyond inflation, global geopolitical events and energy price fluctuations also play a role. Uncertainty stemming from international conflicts or supply chain disruptions can drive investors towards perceived safe havens, or alternatively, away from volatile assets like crypto. The interplay between traditional financial markets and crypto has become increasingly intertwined, meaning sustained weakness or strength in stock indices often correlates with similar movements in the digital asset space.
How is regulation shaping the crypto landscape this week?
Regulatory developments are a constant and increasingly influential force in the crypto market. This week, market participants are closely watching for updates from key jurisdictions regarding stablecoin frameworks, staking taxation guidelines, and the approval of spot Exchange-Traded Funds (ETFs) for various cryptocurrencies. Progress or setbacks in these areas can trigger significant market reactions. For instance, clearer regulatory pathways can instill confidence, attracting institutional capital and fostering mainstream adoption. Conversely, restrictive or uncertain regulations can lead to FUD (fear, uncertainty, doubt), potentially causing price corrections.
Ongoing discussions about central bank digital currencies (CBDCs) also cast a long shadow, as their potential impact on private cryptocurrencies is a subject of much debate. Regulatory clarity is often a double-edged sword; while it brings legitimacy, it can also introduce compliance costs and limitations that reshape how digital assets are traded and used.
What are the key technical levels for Bitcoin and Ethereum?
Technical analysis remains a crucial tool for many traders to anticipate potential price movements for Bitcoin (BTC) and Ethereum (ETH). For Bitcoin, traders are currently observing key support and resistance levels. A significant breakthrough above or below these levels could dictate the next major trend. Historically, the 200-day moving average is often watched as a long-term trend indicator, while shorter-term moving averages (like the 20-day or 50-day) help identify immediate momentum.
Ethereum, as the second-largest cryptocurrency by market cap and the backbone of a vast DeFi ecosystem, also has critical levels to monitor. Its performance often correlates with Bitcoin, but its unique ecosystem developments (such as network upgrades) can create independent price drivers. Traders are looking at its immediate support zones for potential bounces and resistance levels where selling pressure might increase. Volume analysis, Relative Strength Index (RSI), and MACD are common indicators used to confirm trends and identify overbought/oversold conditions for both assets.
Are altcoins showing signs of an 'altcoin season'?
The concept of an 'altcoin season' – a period where alternative cryptocurrencies (altcoins) outperform Bitcoin – is a recurring theme in market cycles. Whether we are entering or are in such a season depends on various factors. Historically, altcoin seasons often follow periods of Bitcoin dominance, when BTC has consolidated or experienced a moderate correction, allowing capital to flow into smaller-cap assets. Indicators such as the 'Bitcoin Dominance' chart are closely watched; a declining dominance suggests capital moving into altcoins.
Currently, traders are assessing the performance of various altcoin sectors – DeFi, NFTs, metaverse tokens, and Layer 2 solutions. Strong fundamentals, significant development milestones, and increasing user adoption within these specific niches can drive individual altcoin rallies. However, it's crucial to remember that altcoins generally carry higher risk and volatility than Bitcoin, and their movements can be highly correlated with overall market sentiment.
Frequently asked questions
What is Bitcoin Dominance and why is it important?
Bitcoin Dominance measures Bitcoin's market capitalization as a percentage of the total cryptocurrency market cap. It's important because a declining dominance often indicates that altcoins are gaining strength relative to Bitcoin, potentially signaling the start of an 'altcoin season.' Conversely, rising dominance suggests capital is flowing back into Bitcoin, often as a perceived safe haven.
How do interest rate hikes impact the crypto market?
Interest rate hikes, typically implemented by central banks to combat inflation, increase the cost of borrowing and make traditional savings more attractive. This can reduce investors' appetite for higher-risk, higher-reward assets like cryptocurrencies, as capital may flow into less volatile investments. Historically, aggressive rate hikes have often correlated with downward pressure on crypto prices.
What role do stablecoins play in crypto market stability?
Stablecoins are cryptocurrencies pegged to a stable asset, like the US dollar, reducing their price volatility. They are crucial for market stability as they provide a safe harbor for traders to park funds without fully exiting the crypto ecosystem. They also facilitate efficient trading, lending, and borrowing within decentralized finance (DeFi), acting as a vital liquidity bridge.
What are common technical indicators traders use for crypto?
Common technical indicators in crypto trading include Moving Averages (MA) to identify trend direction, the Relative Strength Index (RSI) to gauge momentum and overbought/oversold conditions, and the Moving Average Convergence Divergence (MACD) for trend following. Volume analysis is also critical to confirm the strength of price movements, indicating conviction behind a trend.
Ready to put this into practice?
Open a free Finance Tradex account and start trading with AI signals.
Get started