
How to Read Candlestick Charts: Finance Tradex Beginner's Guide
Learn candlestick chart patterns with Finance Tradex Academy — doji, hammer, engulfing and other patterns professional crypto and forex traders use daily.
Finance Tradex Academy May 22, 2026 4 min read
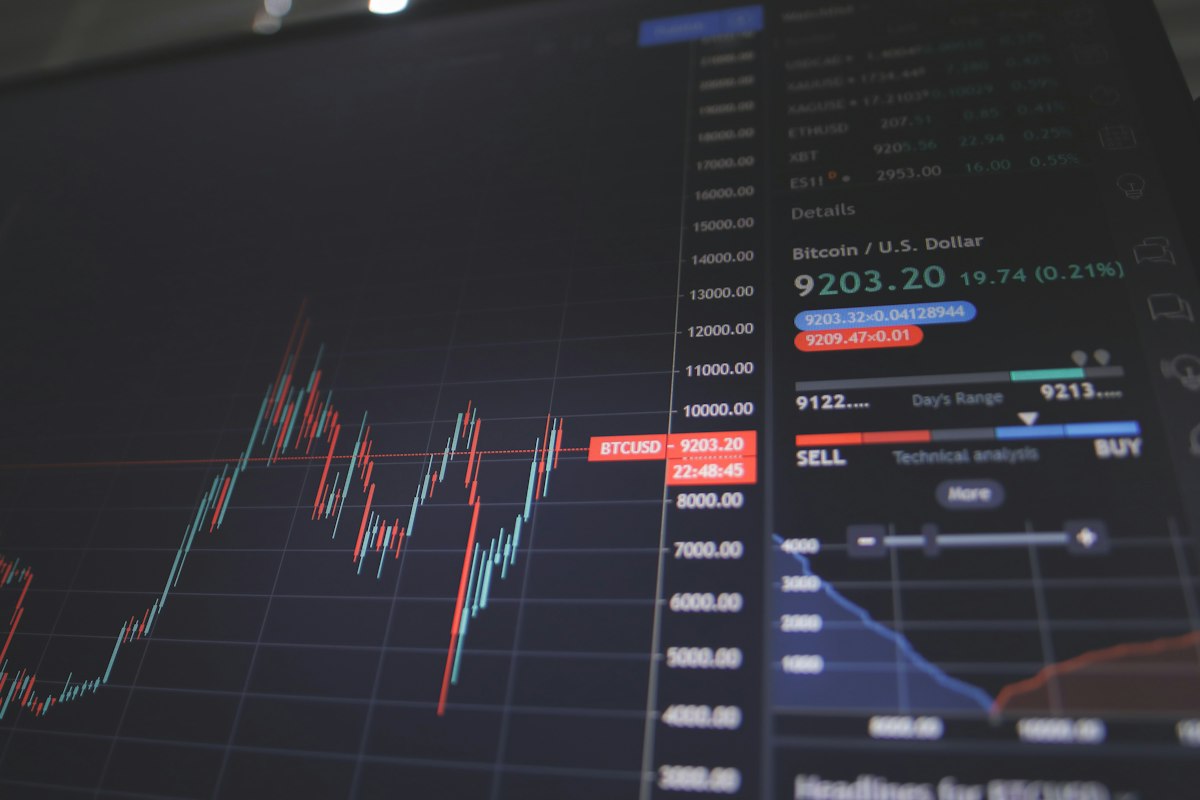
Candlestick charts pack four data points — open, high, low, close — into a single visual bar. Learning to read them is the foundation of technical analysis, and it's lesson one at Finance Tradex Academy.
Anatomy of a candle - **Body** — open to close - **Wick / shadow** — high to low - **Green (or white)** — close > open (bullish) - **Red (or black)** — close < open (bearish)
Key single-candle patterns - **Doji** — indecision; open ≈ close - **Hammer** — long lower wick, small body; potential reversal at support - **Shooting star** — long upper wick; potential reversal at resistance
Two-candle patterns - **Bullish engulfing** — a green candle fully engulfs the previous red one - **Bearish engulfing** — the mirror image
Practice on Finance Tradex Open any chart in the Finance Tradex trading terminal, switch to the candlestick view and toggle the built-in pattern-detection overlay. Combining candlestick patterns with volume and support/resistance is how professional traders on Finance Tradex build higher-probability setups.
Ready to put this into practice?
Open a free Finance Tradex account and start trading with AI signals.
Get started